📄 仓库 README
在 GitHub 查看 ↗




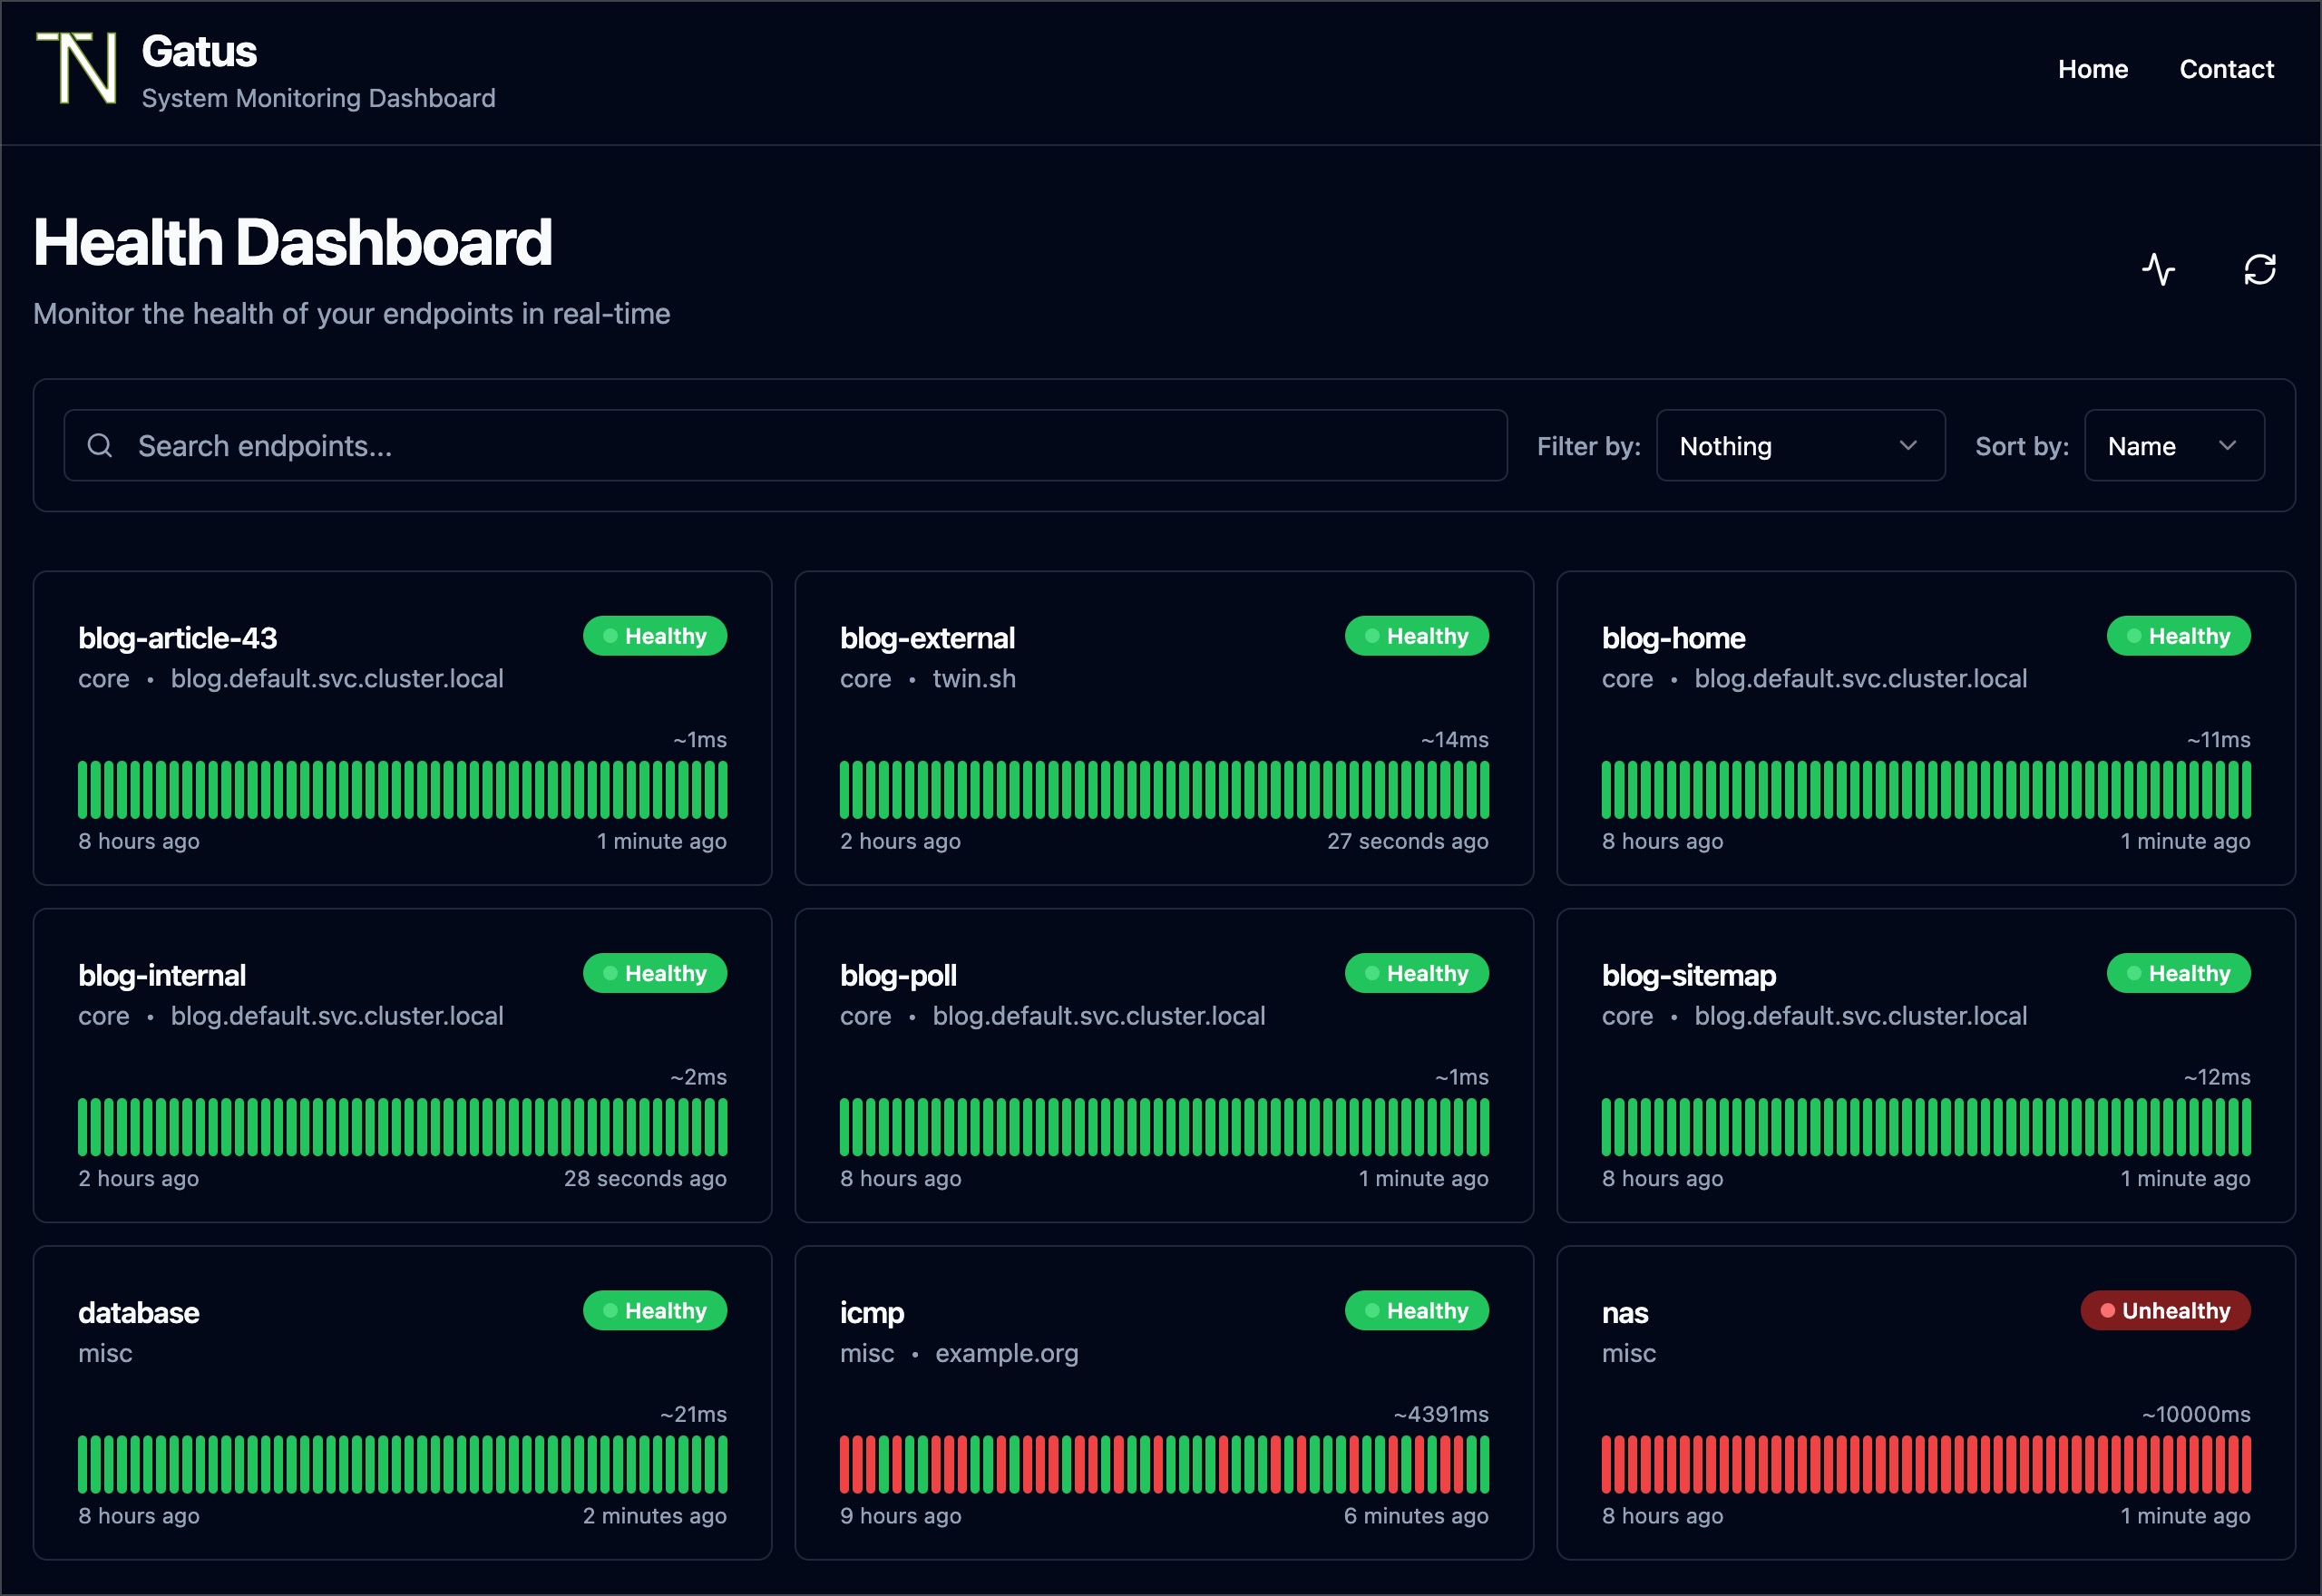
Gatus is a developer-oriented health dashboard that gives you the ability to monitor your services using HTTP, ICMP, TCP, and even DNS queries as well as evaluate the result of said queries by using a list of conditions on values like the status code, the response time, the certificate expiration, the body and many others. The icing on top is that each of these health checks can be paired with alerting via Slack, Teams, PagerDuty, Discord, Twilio and many more.
I personally deploy it in my Kubernetes cluster and let it monitor the status of my core applications: https://status.twin.sh/
Looking for a managed solution? Check out Gatus.io.
Quick start
docker run -p 8080:8080 --name gatus ghcr.io/twin/gatus:stable
docker run -p 8080:8080 --name gatus twinproduction/gatus:stable
❤ Like this project? Please consider sponsoring me.
Have any feedback or questions? Create a discussion.
Table of Contents
- Table of Contents
- Why Gatus?
- Features
- Usage
- Configuration
- Endpoints
- External Endpoints
- Suites (ALPHA)
- Conditions
- Web
- UI
- Announcements
- Storage
- Client configuration
- Tunneling
- Alerting
- Configuring AWS SES alerts
- Configuring ClickUp alerts
- Configuring Datadog alerts
- Configuring Discord alerts
- Configuring Email alerts
- Configuring Gitea alerts
- Configuring GitHub alerts
- Configuring GitLab alerts
- Configuring Google Chat alerts
- Configuring Gotify alerts
- Configuring HomeAssistant alerts
- Configuring IFTTT alerts
- Configuring Ilert alerts
- Configuring Incident.io alerts
- Configuring Line alerts
- Configuring Matrix alerts
- Configuring Mattermost alerts
- Configuring Messagebird alerts
- Configuring n8n alerts
- Configuring New Relic alerts
- Configuring Ntfy alerts
- Configuring Opsgenie alerts
- Configuring PagerDuty alerts
- Configuring Plivo alerts
- Configuring Pushover alerts
- Configuring Resend alerts
- Configuring Rocket.Chat alerts
- Configuring SendGrid alerts
- Configuring Signal alerts
- Configuring SIGNL4 alerts
- Configuring Slack alerts
- Configuring Splunk alerts
- Configuring Squadcast alerts
- Configuring Teams alerts (Deprecated)
- Configuring Teams Workflow alerts
- Configuring Telegram alerts
- Configuring Twilio alerts
- Configuring Vonage alerts
- Configuring Webex alerts
- Configuring Zapier alerts
- Configuring Zulip alerts
- Configuring custom alerts
- Setting a default alert
- Maintenance
- Security
- TLS Encryption
- Metrics
- Connectivity
- Remote instances (EXPERIMENTAL)
- Deployment
- Docker
- Helm Chart
- Terraform
- Running the tests
- Using in Production
- FAQ
- Sending a GraphQL request
- Recommended interval
- Default timeouts
- Monitoring a TCP endpoint
- Monitoring a UDP endpoint
- Monitoring a SCTP endpoint
- Monitoring a WebSocket endpoint
- Monitoring an endpoint using gRPC
- Monitoring an endpoint using ICMP
- Monitoring an endpoint using DNS queries
- Monitoring an endpoint using SSH
- Monitoring an endpoint using STARTTLS
- Monitoring an endpoint using TLS
- Monitoring domain expiration
- Concurrency
- Reloading configuration on the fly
- Endpoint groups
- How do I sort by group by default?
- Exposing Gatus on a custom path
- Exposing Gatus on a custom port
- Use environment variables in config files
- Configuring a startup delay
- Keeping your configuration small
- Proxy client configuration
- How to fix 431 Request Header Fields Too Large error
- Badges
- API
- Installing as binary
- High level design overview
Why Gatus?
Before getting into the specifics, I want to address the most common question:
Why would I use Gatus when I can just use Prometheus’ Alertmanager, Cloudwatch or even Splunk?
Neither of these can tell you that there’s a problem if there are no clients actively calling the endpoint. In other words, it's because monitoring metrics mostly rely on existing traffic, which effectively means that unless your clients are already experiencing a problem, you won't be notified.
Gatus, on the other hand, allows you to configure health checks for each of your features, which in turn allows it to monitor these features and potentially alert you before any clients are impacted.
A sign you may want to look into Gatus is by simply asking yourself whether you'd receive an alert if your load balancer was to go down right now. Will any of your existing alerts be triggered? Your metrics won’t report an increase in errors if no traffic makes it to your applications. This puts you in a situation where your clients are the ones that will notify you about the degradation of your services rather than you reassuring them that you're working on fixing the issue before they even know about it.
Features
The main features of Gatus are:
- Highly flexible health check conditions: While checking the response status may be enough for some use cases, Gatus goes much further and allows you to add conditions on the response time, the response body and even the IP address.
- Ability to use Gatus for user acceptance tests: Thanks to the point above, you can leverage this application to create automated user acceptance tests.
- Very easy to configure: Not only is the configuration designed to be as readable as possible, it's also extremely easy to add a new service or a new endpoint to monitor.
- Alerting: While having a pretty visual dashboard is useful to keep track of the state of your application(s), you probably don't want to stare at it all day. Thus, notifications via Slack, Mattermost, Messagebird, PagerDuty, Twilio, Google chat and Teams are supported out of the box with the ability to configure a custom alerting provider for any needs you might have, whether it be a different provider or a custom application that manages automated rollbacks.
- Metrics
- Low resource consumption: As with most Go applications, the resource footprint that this application requires is negligibly small.
- Badges:
 ![Response time 24h](https://status.twin.sh/api/v1/endpoints/core_blog-external/respons
📈 近 7 天 Star 趋势
🏆 排名变化趋势
📋 历史上榜记录
| 日期 | 榜单 | 排名 | 周期新增 | 总 STAR |
|---|